Ensuring Equity: State Strategies for Monitoring COVID-19 Vaccination Rates by Race and Other Priority Populations
Emily Zylla, Sydney Bernard & Elizabeth Lukanen, SHADAC
The rollout of vaccines designed to end the coronavirus (COVID-19) crisis is in high gear across the United States. In most cases, each state is responsible for determining how to allocate, distribute, track, and report its vaccine allotment from the federal government. Since the beginning of the pandemic, Black, Indigenous, and other people of color have been disproportionately impacted by both higher risks of infection and poorer health outcomes, and many are concerned that an inequitable or inefficient distribution of the COVID-19 vaccine may further widen health inequities among these populations.
The mass vaccination of the U.S. population has already proven to be a complicated and challenging endeavor. Even when not in the midst of a global pandemic, vaccination campaigns have often fallen short of population immunity targets. Recent analysis from colleagues at SHADAC, at the University of Minnesota, found that vaccination rates ranged widely by age, race and ethnicity, income and health status. If these patterns serve as hint to challenges a COVID-19 vaccination campaign can expect, the study authors cautioned that policymakers should keep in mind that “U.S. and state populations are not monoliths but instead are comprised of many segments, some of which will be more challenging to reach and are likely to require targeted efforts.”
One way to help ensure the equitable administration of COVID-19 vaccine is to track vaccine administration disaggregated for key subpopulations, such as gender, race and ethnicity, and geography (e.g., urban vs. rural). The Centers for Disease Control and Prevention (CDC) currently reports overall US COVID-19 vaccine distribution and administration numbers, and on February 1, the CDC published the first national look at demographic characteristics of persons vaccinated (including by race and ethnicity). That report found that nationally 60.4 percent of persons vaccinated were White, 14.4 percent were categorized as multiple or other race/ethnicity, 11.5 percent were Hispanic/Latino, 6.0 percent were Asian, 5.4 percent were Black, 2.0 percent were American Indian/Alaskan Native, and 0.3 percent were Native Hawaiian or other Pacific Islander. These results have to be interpreted carefully, however, because race/ethnicity data was unknown or not reported for 48.1% of the population that was vaccinated.
Several states are reporting their own vaccine related demographic data, which can be helpful for state planning and vaccination efforts. In this expert perspective, we look at what data states are currently publically reporting related to vaccine administration. Specifically, we provide an interactive map that explores the extent to which all 50 states are reporting vaccine administration data breakdowns by age, gender, race, ethnicity, provider type, and level of geography. We also highlight examples of new equity-related measures states are tracking and reporting related to vaccine administration. We discuss what current data sources states are using to provide this information, and finally, we provide an overview of options states can consider to collect information about the administration of COVID-19 vaccine in populations via survey data. Going forward, SHADAC will be tracking and updating this data periodically as we expect more states to report vaccine administration by subpopulation over time.
States’ Reporting of COVID-19 Vaccine Administration Data
All 50 states and the District of Columbia (D.C.) now report the total number of vaccine doses administered on some type of public website or vaccine dashboard. The map below (Figure 1) shows how states are reporting disaggregated metrics related to vaccine administration, and can be filtered to highlight which states are reporting by each category. States marked by a darker shade highlight color are reporting more data breakdown categories than lighter-shaded states. Clicking on a state provides a link to each state’s vaccine-reporting website.
Figure 1.
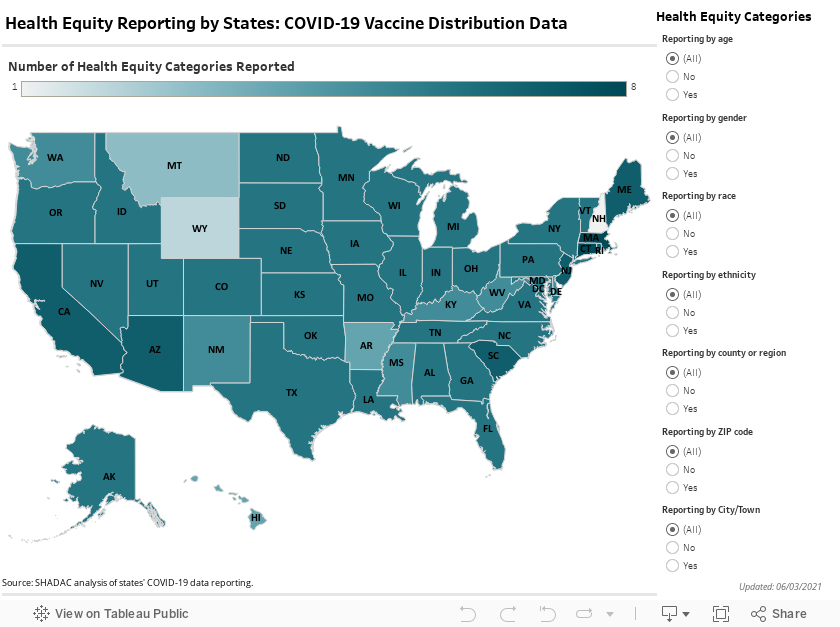
Forty-seven states are reporting doses administered by age, and 43 states are reporting by gender. Almost all states (47), with the exception of Montana, New Hampshire, Oklahoma and Wyoming, are now reporting vaccine doses administered by race; and 44 states are reporting doses administered by ethnicity. Thirty states report information about how the administration of vaccine doses by race and ethnicity compares to the state’s underlying population distribution. Indiana, for example, displays the percent of vaccinations by race and ethnicity category as well as the percent of the state population for each category (Figure 2).
Figure 2. Indiana Statewide Demographics for Vaccinated Individuals

Nineteen states currently report how many doses are administered by various provider types (e.g. hospitals, pharmacies, local public health, community clinics, primary care, tribal health, etc.). Forty-eight states now report how many vaccines have been administered at the county (or regional) level. Two states, New Jersey and Rhode Island, report vaccine administration at the city or town level; and six states, Arizona, California, Connecticut, Maine, Massachusetts, and South Carolina, report vaccine administration at the zip code level (Figure 3). South Carolina, for example, provides a map of people vaccinated by county of residence that allows the user to hover over each individual county to see how many individuals have received either the first dose or completed series of COVID-19 vaccine. The state also indicates how many cases for which the county of residence data is missing, which is helpful to interpret the completeness of the data. (Figure 3).
Figure 3. People Vaccinated by Zip Code of Residence: South Carolina

Current Vaccine Demographic Data Sources
According to a review of states’ vaccination distribution plans, most states are using either their existing immunization information (IIS) systems, PrepMod (the CDC-supported Vaccine Administration Management System), or both systems to support their vaccine management and reporting. Not all states’ IIS systems, however, currently have the capability to report all demographic breakdowns that might be of interest, such as race and ethnicity. We do know, however, that some states are currently working on changes to their systems to allow for the addition of race and ethnicity data from incoming records. For example, one state’s vaccination distribution plan, indicated that it could take at least six months for such changes to be implemented. Additionally, some states’ systems are capable of collecting information such as race and ethnicity, but they are not required fields during data entry, therefore the data is often not complete.
New Vaccine Administration Equity Measures
In addition to the demographic data above, several states are beginning to report additional equity-related vaccine administration data. Minnesota, for example, added an “Equity Metric” to its COVID-19 Vaccine Dashboard (Figure 4). This metric displays the vaccinated population of Minnesota by Social Vulnerability Index quartiles. The Social Vulnerability Index (SVI) ranks geographic areas on 15 social factors (unemployment, disability, access to transportation, poverty, race/ethnicity, homelessness, etc.) to summarize multiple dimensions of disadvantage. In Minnesota’s dashboard, ZIP codes are grouped into four quartiles based on their degree of disadvantage. (Q1 = “High Disadvantage”; Q2 = “Medium-High Disadvantage”; Q3 = “Medium-Low Disadvantage”; Q4 = “Low Disadvantage”). As of June 1, this data shows Minnesotans who live in the highest risk SVI quartile are vaccinated at a lower rate proportionate to their share of the overall population compared to those Minnesotans who live in the highest SVI quartile.
Figure 4. Minnesota’s Vaccine Equity Metric

North Carolina created a new interactive tool to map social vulnerability (measured by the SVI) and vaccination rates by census tract. The map (Figure 5) provides a visual snapshot highlighting the areas of the state with the highest rates of social vulnerability (areas in red) and the lowest rates of COVID-19 vaccination (smallest teal circles). When a user hovers their mouse over each census tract a pop-up window displays demographic about that specific area, including the percent of households speaking limited English, the percent of households with no vehicle available, and the percent of African American, American Indian/Alaska Native and LatinX populations. The state encourages vaccine providers and partners to use the map to determine where to conduct outreach efforts and where to locate vaccination sites and mobile units.
Figure 5. North Carolina Vaccines by Census Tract

Using Survey Data to Supplement Vaccine Administration Data
If states cannot disaggregate vaccine administration data by categories of interest, such as race or ethnicity, survey data could be used to provide an alternative or supplementary way for states to assess vaccine distribution in terms of determining the impact on individual-level health equity. Depending on the particular design of such a survey, it is possible these data would only be available after a considerable time lag. However, it might be the only way for some states to understand the distribution of vaccines by populations of interest. Additionally, it is possible that vaccination campaigns may struggle to effectively reach some disenfranchised segments of state populations for extended time periods, so the lag times associated with surveys may not be particularly problematic for identifying persistent vaccination gaps.
One potential vehicle for this data collection is the Behavioral Risk Factor Surveillance System (BRFSS). The BRFSS survey is an annual telephone survey that collects data on civilian noninstitutionalized individuals aged 18 years and older across all 50 states and D.C. The survey focuses on health-related risk behaviors, chronic health conditions, and use of preventive services. The survey is supported by the CDC, but is conducted independently by individual states. All states are required to administer standardized core questionnaire, but states also have the flexibility to add survey questions or supplement sample in order to gather information on either specific populations or to address specific health issues.
Each state has a unique process for adding questions or oversampling a particular group or geography, and the cost of adding questions varies (based on a review of publically available information, costs commonly range from $3,000 to $5,000 per question, while only one state provided a cost estimate to add sample, at $100 per additional survey respondent). The process of proposing state-added questions or oversample is managed by the BRFSS State Coordinator in each state and these changes are typically considered in the late summer/early fall of the year preceding the survey. For example, some states, such as Florida, have used BRFSS to ask questions about potential sources of COVID-19 and prevention behaviors.
On March 12, 2021 the CDC requested approval to add an optional questionnaire module about COVID vaccination to the BRFSS survey. CDC is recommending that the following questions be added in mid-year 2021 after vaccinations are available:
- Since [DATE OF VACCINE AVAILABILITY], have you had a COVID-19 vaccination?
- How many COVID-19 vaccinations have you received?
- During what month and year did you receive your (first) COVID-19 vaccination?
- At what kind of place did you get your (first) COVID-19 vaccination?
- During what month and year did you receive your second COVID-19 vaccination?
- At what kind of place did you get your second COVID-19 vaccination?
Optional module questions, such as the ones above, are standardized questions that have been cognitively tested. Once selected, a module has to be used in its entirety and asked of all eligible respondents. To-date, five states (Alaska, Illinois, Missouri, New Jersey and North Carolina) have already indicated that they will be adding the COVID vaccine-related module to their BRFSS surveys. North Carolina also plans to include the following state-added question:
- What is the MAIN reason you have NOT received a COVID19 vaccination?
One important consideration for using the BRFSS is the sample size available for populations of interest such as specific racial and ethnic groups. In most states, the sample size is robust enough to produce estimates for Whites, Black and Latino populations. The feasibility of readily producing precise estimates for Asians and Pacific Islanders, and American Indian and Alaska Natives is limited to a smaller sub-set of states, depending on the overall samples size (which is related to the size of the state) and the size of those populations within the state.
While the BRFSS has some obvious limitations, such as a focus on noninstitutionalized adults and a time lag, the benefits include being able to link this information to the broad range of demographic data collected by the survey as well as rich information on health conditions and risk factors. States interested in using the BRFSS to monitor COVID-19 vaccine distribution should start working with their BRFSS state coordinators now to assess the sample size of priority subpopulations and to discuss the process for including state-added questions and/or additional sample size to address their vaccine distribution monitoring goals.
Another approach that states can take to gather more timely information on vaccine distribution is to conduct independent, state-specific surveys or polls. Since March, roughly half of states in the country have gathered information from their residents on COVID. These data collection efforts vary in scale, size, cost and sponsoring entity (e.g. surveys have been conducted by state universities, state and local health departments, health policy groups, and partnerships between universities and the media). A benefit of conducting an independent survey or poll is the speed with which you can field and produce relevant data and the ability to fully customize the content. The major drawback is cost, which could seriously limit sample size.
The U.S. Census Bureau’s Household Pulse Survey (HPS), which is an ongoing, weekly tracking survey designed to measure impacts of the COVID-19 pandemic, is an example of a survey tool states could use to monitor rates of vaccination by demographic and socioeconomic factors closer to real-time. On January 27th, the HPS released new state-level data on the take-up of COVID-19 vaccines. Colleagues at SHADAC recently explored the top-level findings from this survey as well as the pros and cons of this data source in a blogpost. Overall, from February 17 – March 1, 2021 Asian and White adults continue to be likely to have received a vaccine than Black and Hispanic adults, and adults in the highest income category were twice as likely to have been vaccinated than those in the lowest income category.
It is evident that the COVID-19 pandemic highlighted and exacerbated existing inequities in the health care system. As states seek strategies to begin to breakdown and address these inequities, they can look to their vaccine administration tracking data to ensure that those populations most affected by COVID-19 are able to receive equitable access to needed preventive care.